Chemometrics
Protea’s expertise in chemometric methodology allows for both standard and propriety algorithms to be applied to our IR and MS spectral data to extract meaningful gas measurement information. This can be done within the code so the user can run the analyser simply, or Protea can provide full access and training to our chemometric method building software to allow the expert user to get the most from the equipment.
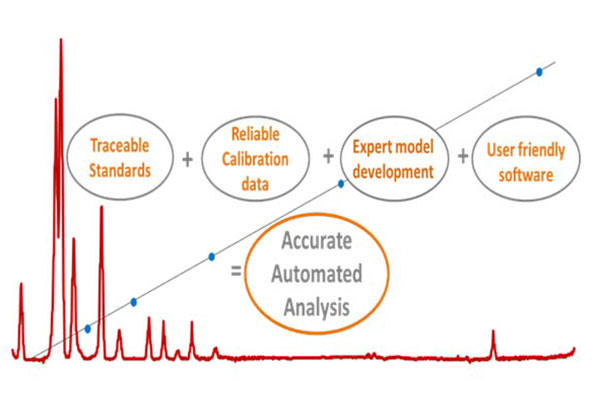
Spectroscopic data are often complex, containing large numbers of features which often overlap. Protea uses chemometrics, literally meaning the measurement of chemical information, in order to simplify data into meaningful and accurate information. Protea’s FTIR and QMS gas analysers are provided with the chemometric methods programmed into the software for the application of interest.
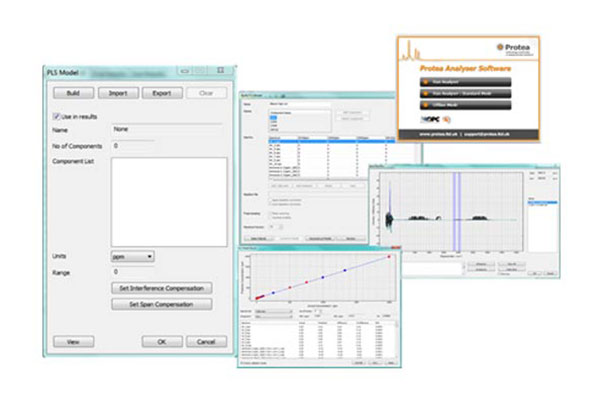
Protea’s own in-house software offers customers the ability to perform chemometrics analysis on data sets. The software is designed so that untrained users can simply run preloaded models, but will also allow more advanced users to build and develop models.
Our dedicated application specialists have experience of developing and implementing chemometric techniques on hundreds of projects. We can provide in-depth training courses on chemometric techniques and data analysis of spectroscopic measurements, enabling our customers to benefits from the power of chemometrics.
As any chemometric technique will only ever be as good as the calibration data it is based on, Protea performs all calibrations in a purpose built calibration lab using certified traceable standards.
Univariate analysis
The univariate or area analysis method involves the use of a single calibration spectrum, of a single measurement component, at a single concentration. A simple univariate model is generated by measuring the area under a spectral peak in this calibration spectrum. By applying Beer’s Law (linear relationship between area and concentration), we can calculate the same peak areas of sample spectra and predict the concentration in the samples using the single calibration spectrum as a reference.
These models are quick and simple to construct, but are best suited to single component gas matrices with limited concentration. For complex, dynamic gas mixtures multivariate analysis is used.
Univariate models give quick quantified measurements, but are only suitable for single component sample mixes that are of limited ranges. Protea Analyser Software allows univariate models to be built quickly and simply, also allowing the model to be span corrected over a range to increase the measurement range. However, if there are interference between many overlapping spectral features more complex analysis techniques are required.
Multivariate analysis
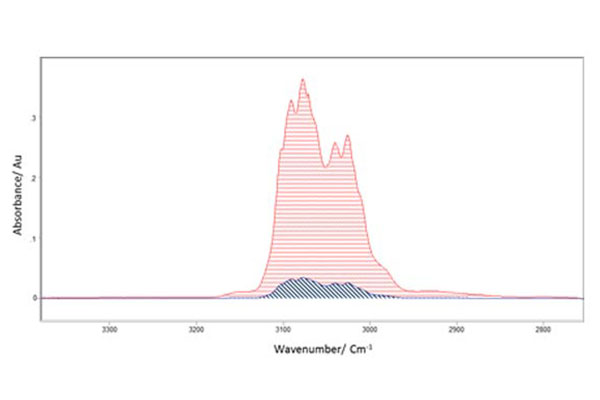
Multivariate analytical techniques, often referred to as modelling, are used when more than one component is measured in multiple concentrations, over multiple wavenumbers, with numerous interfering species. A model is built upon a dedicated calibration set of spectra of known gases at known concentrations. Once we have collected the calibration set, we apply different statistical techniques of regression on that data set to generate the model.
As practiced chemometricans and analysts, Protea know that there is never a single technique that works best in all applications. Protea offers a number of techniques with our instruments, enabling the best solution to any application problem to be found. Protea will deliver a working analytical model for each application into which a system is delivered.
Classical Least Squares (CLS)
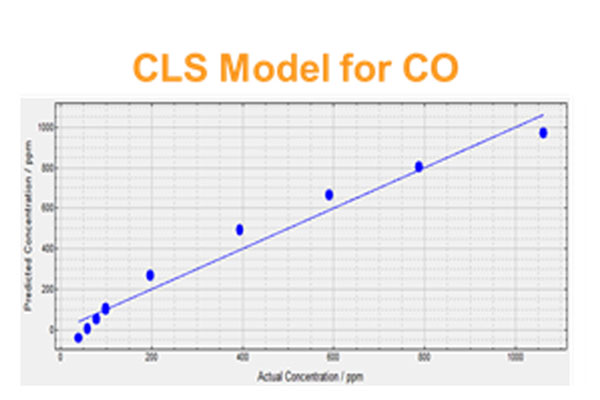
The simplest and most common multivariate technique used in gas-phase spectroscopy is Classical Least Squares (CLS). The CLS method is based on the standard Beer’s law equation, which describes the total spectral absorbance as the summation of the absorptions for each species. For this reason it is important when using CLS that we know all the constituent components making up a sample.
CLS modelling will provide a linear model of all the species that the model is built to include. If a substance not present in the model is in the sample, then the model will fail in its predictions. If a substance with a non-linear response of absorption vs. concentration is attempted to be model, a non-linear resulting model will be produced. CLS models are quick to build, to edit and to add new calibrations too and are a relatively simple method for applying to Mid-IR gas phase analyses.
Partial Least Squares (PLS)
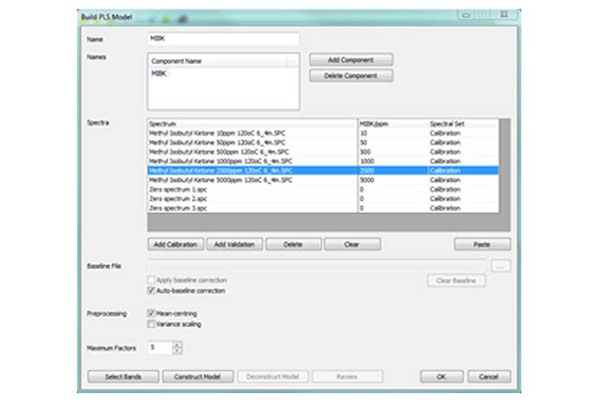
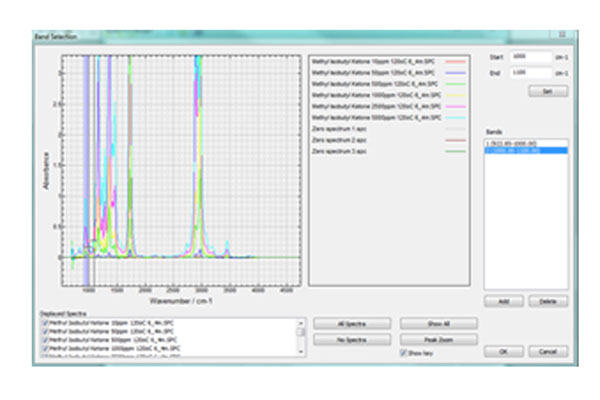
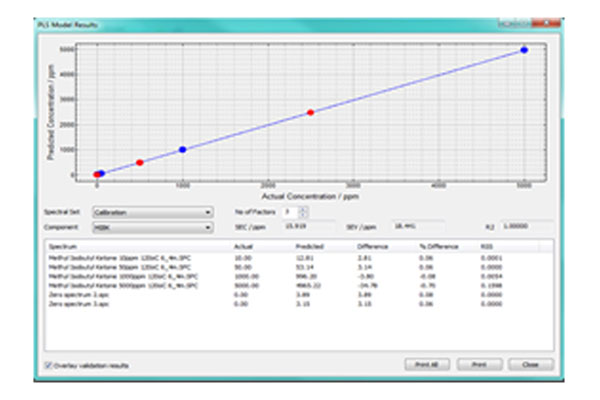
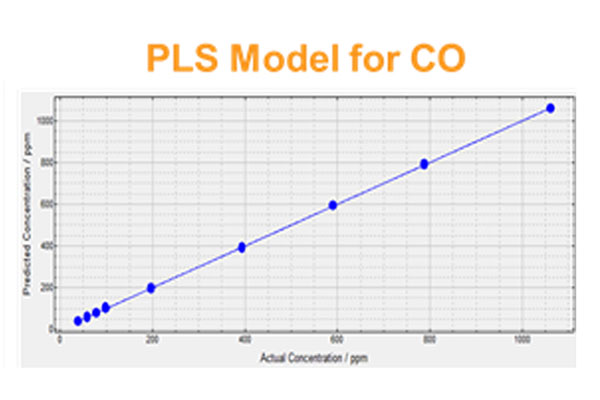
Partial Least Squares (PLS) is Protea’s method of choice for accurate, robust prediction results from spectroscopic data. PLS modelling involves the notion of factors that describe the collinear relationship between spectral absorption and concentration.
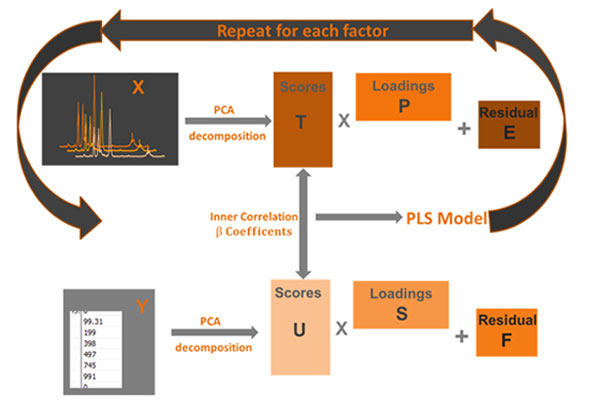
The PLS method is related to Principal Component Analysis (PCA), where data is screened for correlations, each correlation being described by a Principal Component or factor. The algorithm will attempt to find factors which describe covariance (how variables vary within relation to each other) and achieve correlation between wavenumbers and spectral absorbance or concentrations. The PLS model will find combinations of wavenumbers which maximise the variance, but only the variance which is relative for predicting the concentration.
In PLS modelling, the concentration data is used in the decomposition of the data into the descriptive factors as well as the spectroscopic data.
This has the effect of weighting the higher concentration data more favourably and getting accurate prediction results from as few factors as possible i.e. we get the best model for each gas, rather than a single model to predict all gases.
The algorithms employed in PLS model building are significantly more complex than CLS, but what results is a set of models that are directly related to the concentration vs. absorbance response of the components of interest. If a PLS model is built with 5 constituents of interest, 5 PLS models are generated each specific to a constituent. Compared to CLS, where there is a single model for all constituents, this gives better predictive abilities in cases of wide concentration ranges and many interfering species.
Why PLS over CLS?
Calibration set is smaller: We can build models that work with much smaller data sets, meaning models are quicker and cheaper to build. The major limitation of CLS is that all interfering components need to be known, quantified and included in the calibration set.
Complex Mixtures: PLS has a greater power to separate out components account for interfering species due the covariance based approach. PLS can be used for complex mixtures without the need to fully define the matrix.
Linearity: The CLS method will struggle with species that do not obey Beer’s Law, i.e. are not collinear. This can be overcome by adding data at many concentrations into the calibration set to model the non-linearity. The PLS method allows us to use more factors rather than more data to model these effects.
Noise is less of a problem: As a factor based analysis method PLS uses all the channels (variables) in a prediction and is therefore less susceptible to variations due to noise.
Baseline effects: The CLS equations assume that all responses at a particular wavelength are due entirely to the calibrated components and hence the algorithm is more susceptible to errors due to baseline shifts.
Other Multivariate Approaches
Application specialists at Protea also have experience with many other sophisticated statistical methods, these include:
- Principal Components Analysis (PCA) and Parallel Factor Analysis (PARAFAC)
- Discriminate Function Analysis (DFA) and PLS-DA
- 2D Correlation analysis
- Machine learning and evolutionary algorithms: Artificial Neural Networks (ANNs), Random Forests (RF), Support Vector Machines (SVM) and Genetic Algorithms(GA)