Protea Analyser Software
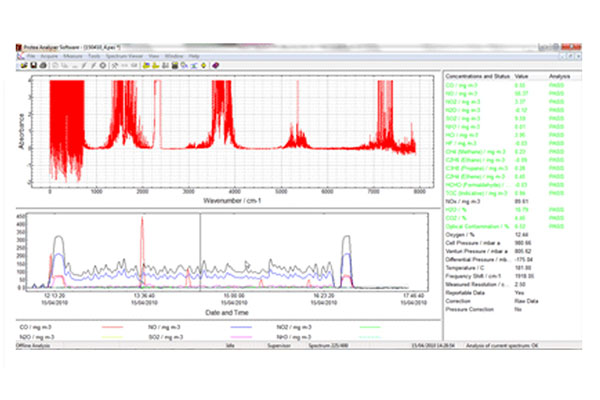
Protea Analyser Software (PAS) is Protea’s standard data acquisition and analysis package for laboratory and mobile field measurements of FTIR data.
As a data collection system, it has all the functionality required of research level FTIR analysis. The trained user can make changes can be made to collection parameters of the spectra, in order to achieve speed of response or detection limit requirements.
But also, running in the dedicated Standard Analysis mode, the un-trained user who is new to FTIR can quickly start collecting and measuring FTIR data. Standard Analysis mode has built in collection and analysis parameters as required when following standard procedures such as environmental emissions monitoring under the MCERTS framework.
As well as collecting FTIR data, PAS allows for connection to Protea’s sampling system control electronics. This monitors and controls sample cell temperature and pressure, provides control for purge valves to the instrument and also relays digital and analogue I/O to external devices.


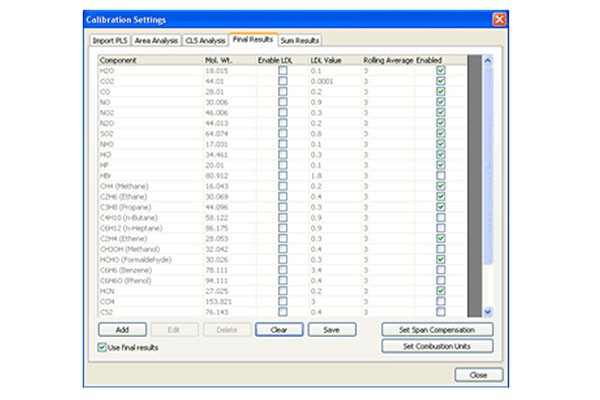
PAS runs a dedicated calibration area, where users can add, remove and develop their own chemometric models.
Models can be span corrected to match reference gas cylinders and linearity checks can be made for compliance with performance standards. When defining analysis methods, PAS also allows for model switching based on constants or other variables. For example, two chemometric models can be built over different ranges, one 0 -100ppm, one 100-1000ppm. PAS will automatically switch and use the most suitable model for the current concentration mix.
A list of some of the features of PAS are given below. To obtain a demo copy, please contact sales@protea.ltd.uk
- Separate background and sample spectrum collection parameters
- Collect interferogram, single-beam, transmission or absorbance
- Spectra saved as .spc format
- Spectra saved with date and time stamped name
- Attach memos to data for process information etc.
- .pas file contains all chemometrics, sampling system and collection results
- Pressure correction, dilution correction, dry/O2 correction of data
- .calib file contains all chemometric models and analysis information
- Build univariate and multivariate (CLS, PLS) models
- Span and linearity correct models Report concentration results as ppm, mg/m3 or %Vol
- Final Results selection allows to select best model for given range
- Sum results, allows results to be added together e.g. total Sulphur species
- Rolling average on results
- Lower Detection Limit calculator and apply lower detection limit to data
- Drift calculator across data batches
- Results summary - average, maximum and minimum of results across a batch
- Analysis summary provides in-depth statistical tests on chemometrics - range, max. absorption peaks, max. residual, noise equivalence tests and F-ratio